 |
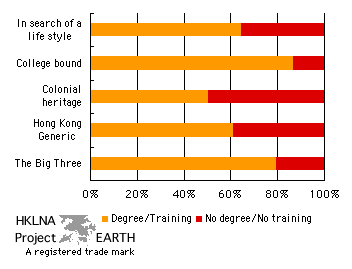
Graph 7 Distribution of subject -trained and subject-nontrained teachers across major subject groups. A subject-trained teacher is one who has received degree or nondegree training in his subject. A nonsubject trained teacher is one who has received no training (degree or nondegree) in the subject he teaches. (return to graph 6) |
| top | |
 |
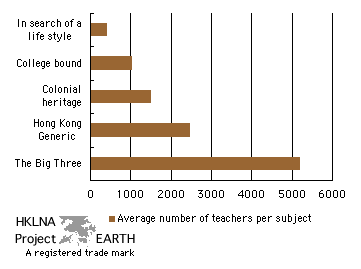
Graph 8 Average number of teachers per subject in each major subject group This statistic was obtained by dividing the total number of teachers in each subgroup by the number of sujects within that subgroup. (return to graph 6) |
| top | |
 |
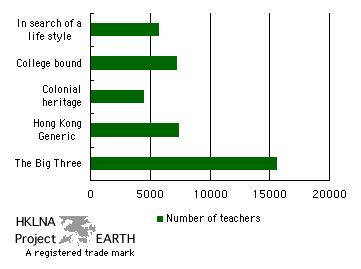
Graph 9 Total number of teachers in each major subject group The total for each group was obtained by summing the number of teachers across all subjects within a particular subgroup. (return to graph 6) |
| top |