 |
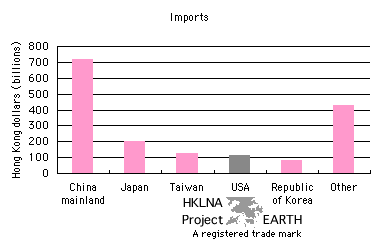
Graph 13 Hong Kong Imports by Principal country of origin - 2000 Gray area indicates country in which English is the native language |
| Note: Countries included in the category Other all demonstrate export levels to Hong Kong smaller than those of the principal exporting countries. Included among these are primarily APEC and EU countries; the vast majority of which are not English speaking. | |
|
|
|
 |
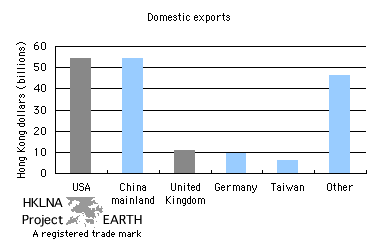
Graph 14 Hong Kong exports by principal country of destination - 2000 Gray area indicates country in which English is the native language |
| Note: Countries included in the category Other all demonstrate import levels from Hong Kong smaller than those of the principal importing countries. Included among these are primarily APEC and EU countries; the vast majority of which are not English speaking. | |
|
|
|
 |
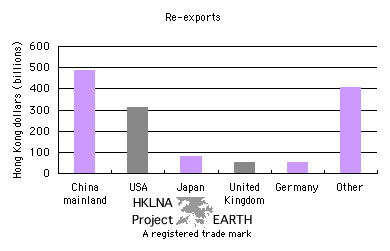
Graph 15 Hong Kong re-exports by principal country of destination - 2000 Gray area indicates country in which English is the native language |
| Note: Countries included in the category Other all
demonstrate import levels of Hong Kong re-exports smaller than those of
the principal importing countries. Included among these are primarily
APEC and EU countries; the vast majority of which are not English
speaking. Note: Re-exports are goods that are not produced in Hong Kong and thus do not contribute directly to Hong Kong's gross domestic product. |
|
|
|
|
| top |