Hong Kong's Information Society
The structure, flow, use, and language of information in Hong Kong society
Hong Kong's Information Technology and Telecommunications Industries
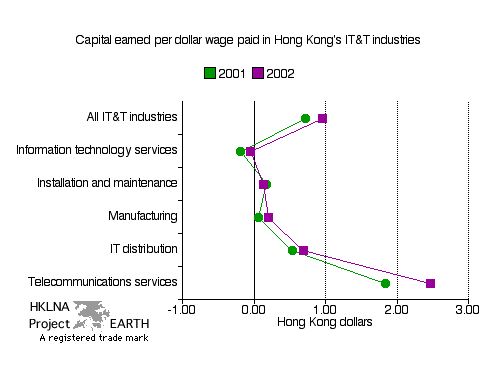
| Graph 103 - Capital earned per Hong
Kong dollar wage paid in 2001 and 2002. graph 98 | graph 99 | graph 100 | graphs 101a, 101b, and 101c | graphs 102a and 102b | data collection (graphs) |
 |
| Note: The data for this
graph were obtained by dividing the data employed in graph 101c (new
window) by that in graph
102a (new window) for each industry. The two data points
corresponding to the category All IT&T industries were
similarly obtained by summing across industries and then dividing. |
| Source: Hong Kong Government. Census and Statistics Department. Information Technology and Telecommunications Statistics Section. 2003. Obtained on special request. EARTH's copy of corresponding table available as .xls or .pdf document on request |
| top |