Hong Kong's Information Society
The structure, flow, use, and language of information in Hong Kong society
Hong Kong's Information Technology and Telecommunications Industries
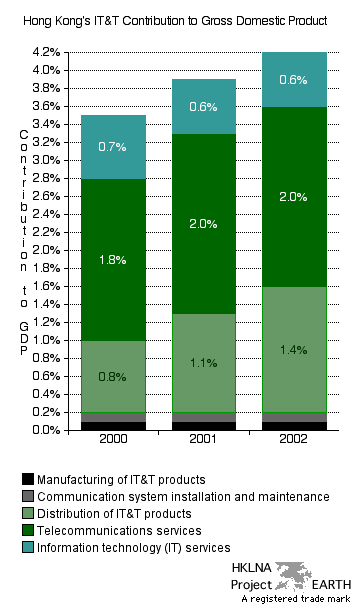
| Graph 98 - IT&T contribution to
Hong Kong's gross domestic product by industry 2000-2002. graph 99 | graph 100 | graphs 101a, 101b, and 101c | graphs 102a and 102b | graph 103 | data collection (graphs) |
 |
| Note: These values were obtained
by adding the amount paid (factor costs) to labor and capital inputs
and dividing by GDP for the entire economy. For a more detailed
explanation see Census and Statistics Department. Statistical Literacy.
Understanding the concepts of gross domestic product. Income
(factor cost) approach. [online
document] (10 June 2004). |
| Source: Hong Kong Government. Census and Statistics Department. Information Technology and Telecommunications Statistics Section. 2003. Obtained on special request. EARTH's copy of corresponding table available as .xls or .pdf document on request |
| top |