Hong Kong's Information Society
The structure, flow, use, and language of information in Hong Kong society
Hong Kong's External Trade in
Information Technology and Telecommunications Products
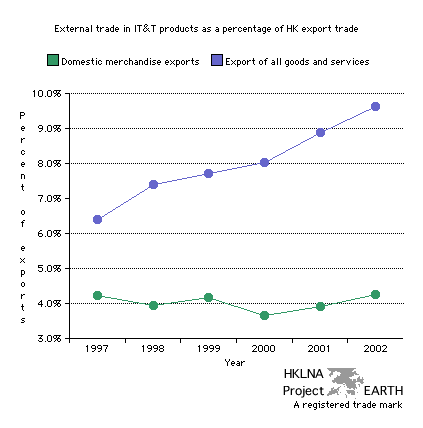
| Graph 106 - IT&T domestic exports
and IT&T merchandise exports
as a percentage of all domestic exports and total exports including all
goods and services, respectively. graph 104 | graphs 105a and 105b | graphs 107a, and 107b | data collection (graphs) |
 |
| Note 1: The Hong Kong government typically distinguishes between domestic exports and (total) exports. Domestic exports differ from (total) exports insofar as domestic exports are produced at home and do not include goods imported for the purpose of re-export (re-exports are goods that are imported and then re-exported with no value added to the goods traded). In this graph the line domestic merchandise exports (green line) compares IT&T domestic goods exports with all domestic goods exports for each of the years indicated. |
| Note
2: The series
labelled export of all goods and services (blue line)
compares IT&T merchandise exports with all goods and
services exports. If IT&T service exports were included the
data points for this series would be somewhat higher. No data for
IT&T
service exports were provided in the report cited below (see tables
6.1, 6.2, and 6.3 of Hong Kong as an Information Society). (graph 107b) |
| Note 3: What we observe in this
graph is that IT&T goods form an ever increasing proportion of
goods received and destined for re-export, while domestic manufacture
of these goods languishes with virtually no change. |
| Source 1: Hong Kong Government. Census and Statistics Department. Information Technology and Telecommunications Statistics Section. 2003. Hong Kong as an Information Society. Chapter 6 - Imports and Exports of Computer Products and Telecommunications Equipment. Table 6.1 Imports by main supplier and exports by main destination of computer hardware, pp. 92-93. Table 6.2 Imports by main supplier and exports by main destination of computer software, p.95. Table 6.3 Imports by main supplier and exports by main destination of telecommunications equipment, pp. 97-98. EARTH's copies are availabe on request. |
| Source 2: Census and Statistics
Department. Hong Kong statistics. Frequently asked statistics. Hong
Kong's trade in services statistics. Exports, imports and net exports
of services by major service group, 2000 - 2002 [online
document - EXCEL file] (15 June 2004).
Also, External trade. External Merchandise Trade. [online
document - EXCEL file] (15 June 2004). EARTH's
copies are available on request. |
| top |