Hong Kong's Information Society
The structure, flow, use, and language of information in Hong Kong society
Hong Kong's External Trade in
Information Technology and Telecommunications Products
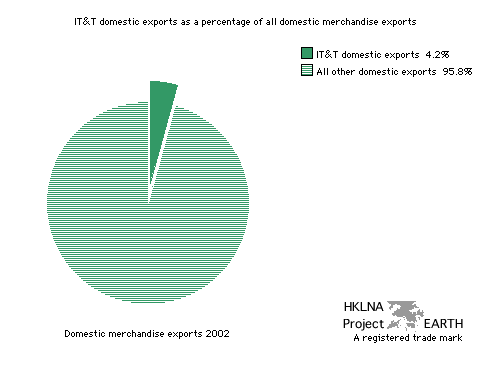
| Graph 107a - IT&T domestic exports
as a percentage of all domestic exports in 2002. graph 104 | graphs 105a and 105b | graph 106 | graph 107b | data collection (graphs) |
 |
| Note 1: The Hong Kong government typically distinguishes between domestic exports and (total) exports. Domestic exports differ from (total) exports insofar as domestic exports are produced at home and do not include goods imported for the purpose of re-export. Re-exports are goods that are imported and then re-exported with no value added to the goods traded. |
| Note 2: In effect this graph
highlights the data point (green dot) 2002
domestic merchandise exports found in graph 106 and is part of a four-graph
comparison (see graphs 105a, 105b, and 107b). |
| Source 1: Hong Kong Government. Census and Statistics Department. Information Technology and Telecommunications Statistics Section. 2003. Hong Kong as an Information Society. Chapter 6 - Imports and Exports of Computer Products and Telecommunications Equipment. Table 6.1 Imports by main supplier and exports by main destination of computer hardware, pp. 92-93. Table 6.2 Imports by main supplier and exports by main destination of computer software, p.95. Table 6.3 Imports by main supplier and exports by main destination of telecommunications equipment, pp. 97-98. EARTH's copies are available on request. |
| Source 2: Census and Statistics
Department. Hong Kong statistics. Frequently asked statistics. Hong
Kong's trade in services statistics. Exports, imports and net exports
of services by major service group, 2000 - 2002 [online
document - EXCEL file] (15 June 2004).
Also, External trade. External Merchandise Trade. [online
document - EXCEL file] (15 June 2004). EARTH's
copies are available on request. |
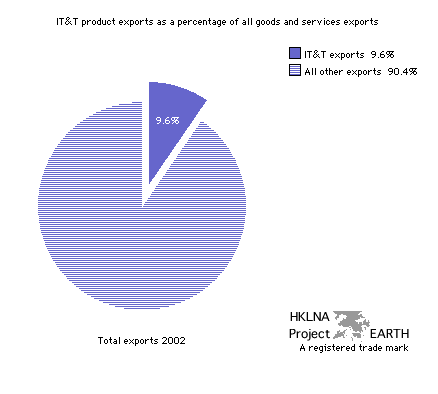
| Graph 107b - IT&T merchandise
exports as a percentage of all exported goods and services in 2002. graph 104 | graphs 105a and 105b | graph 106 | graph 107a | data collection (graphs) |
 |
| Note 1: In this context IT&T exports refers to computer and computer-related hardware, computer software, and telecommunications equipment -- in brief, all IT&T merchandise exports including both re-exports and domestic exports. Please see note 2, graph 106 for greater clarification. |
| Note 2: In effect this graph
highlights the data point (purple dot) 2002
export of all goods and services found in graph 106 and is part of a four-graph
comparison (see graphs 105a, 105b, and 107a). |
| Source 1: Hong Kong Government. Census and Statistics Department. Information Technology and Telecommunications Statistics Section. 2003. Hong Kong as an Information Society. Chapter 6 - Imports and Exports of Computer Products and Telecommunications Equipment. Table 6.1 Imports by main supplier and exports by main destination of computer hardware, pp. 92-93. Table 6.2 Imports by main supplier and exports by main destination of computer software, p.95. Table 6.3 Imports by main supplier and exports by main destination of telecommunications equipment, pp. 97-98. EARTH's copies are available on request. |
| Source 2: Census and Statistics
Department. Hong Kong statistics. Frequently asked statistics. Hong
Kong's trade in services statistics. Exports, imports and net exports
of services by major service group, 2000 - 2002 [online
document - EXCEL file] (15 June 2004).
Also, External trade. External Merchandise Trade. [online
document - EXCEL file] (15 June 2004). EARTH's
copies are available on request. |
| top |