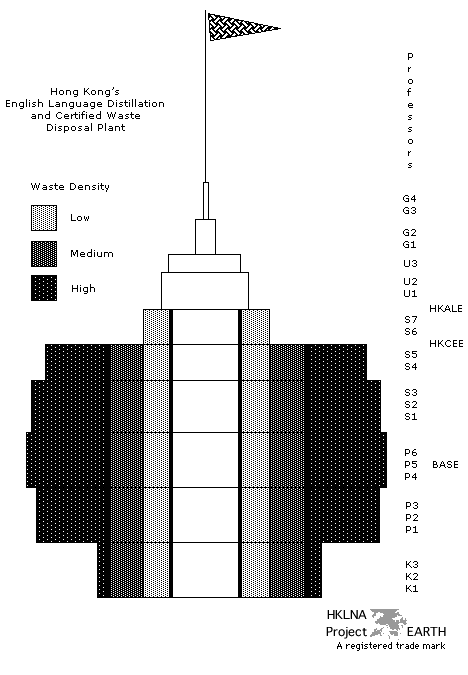
Graph 78 - Hong Kong's English Language
Distillation and Certified Waste Disposal Plant.
table
43 | table 44 | table 45 | table 46 | tables 47a, 47b, and 47c | table 48 | table 49 | table 50 | table 51 | tables 52a, 52b, and 52c | data collection (graphs) quality
assessment (hong kong's
bottom line) |
 |
Note 1: This diagram is
proportional to the values found in table 43. The number of
years spent at each level is vertically proportioned and the number of
students enrolled at each level is horizontally proportioned. Only the
vertical distance of the professorial flagpole is out of proportion.
The flag is mere symbolic decoration. Thus, the shaded areas accurately
reflect the expected waste as a proportion of the total number of
students enrolled in the system.
|
| Note 2: The width of the
base year is equal to one in this diagram.The widths
of all other grade levels are represented as a proportion of the base
year. It was chosen because key stage two had the largest number of
students enrolled. Its width corresponds to one third of the total
number of students enrolled in primary forms IV through VI. |
Note 3: The distance between the
two sets of thick, vertical, parallel lines that appear on either side
of the image represent the results of the HKCEE (outside) and HKALE
(inside). Not everyone who met the minimum eligibility requirements for
entry into form VI entered. Certainly, there were a large number of
those who passed through forms VI and VII, who did not qualify for
entry into a Hong Kong university. There are more first year university
students (U1) than HKALE qualifiers, because not everyone listed as a
first year university student entered directly from secondary form VII.
|
| Data Source: See table 43. |
